
GiAPA – Performance analysis made easy…
Pinpointing reasons for unsatisfactory response times or slow running jobs on a server is by IT most professionals considered a time consuming and complex task often requiring assistance from expensive external experts. With GiAPA that is not the case anymore.
GiAPA was designed to do the complex analysis of collected performance data automatically, and to present performance problems so straight forward that the average operator or programmer can act as “performance experts”.
GiAPA is therefore the quality control tool for the development department, and GiAPA change the performance optimization work mode from “fire extinguishing” to pro-active.
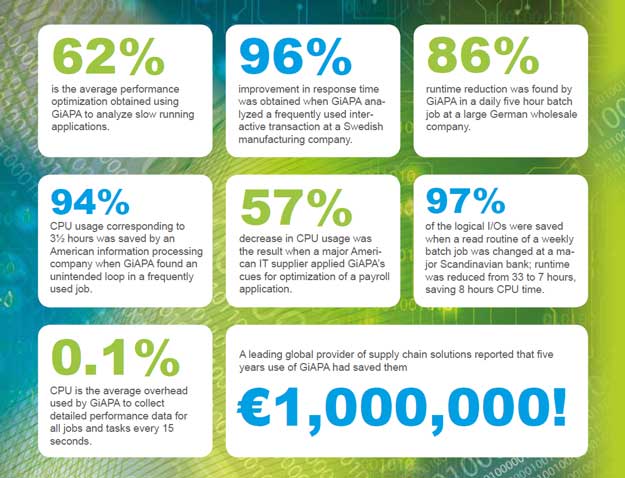
At new customer sites GiAPA almost always detect significant optimization potential in jobs believed to run efficiently. This is possible because GiAPA, in addition to traditional performance data, also collects open file information and analyzes how and which records are accessed, and looks at which programs (incl. IBM I/O-routines) are used.
There are several myths connected to performance optimization. One is that “Machines are so fast today that performance is no concern.” The truth is that the continued increase in data volume means that performance issues remain a concern.
 It is also generally assumed that the modifications needed to optimize larger applications will be very complex, consuming a lot of programmer time. The fact is that the main logic – the complex part of the programs – never is touched. The change needed involves typically a single or very few lines of code, like replacing an inefficient access method, or modifying the way an API is called.
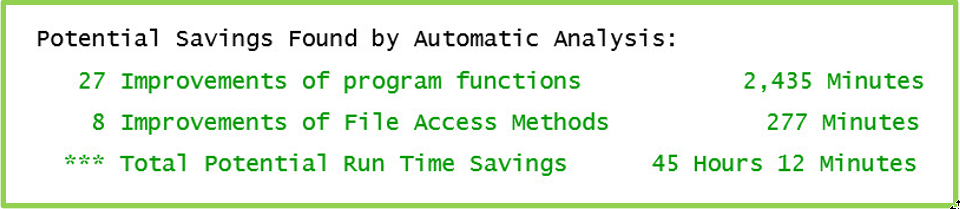
GiAPA’s automatic analysis of the data produces straight forward exception reports showing how programs can be speeded up down to source code statement number. Tutorials available on the GiAPA home page brings within a few hours a programmer up to speed as “performance expert”. 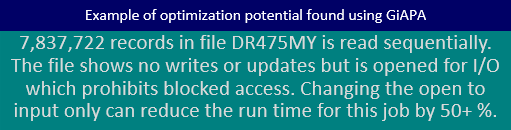
FREE FULLY AUTOMATIC PERFORMANE ANALYSIS includes
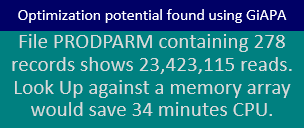
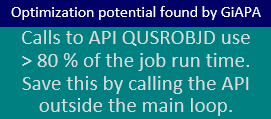
* one Program Optimization Hint example,
* one File Access Optimization hint example, and
* totals for found optimization potential.