Programs Using Most CPU
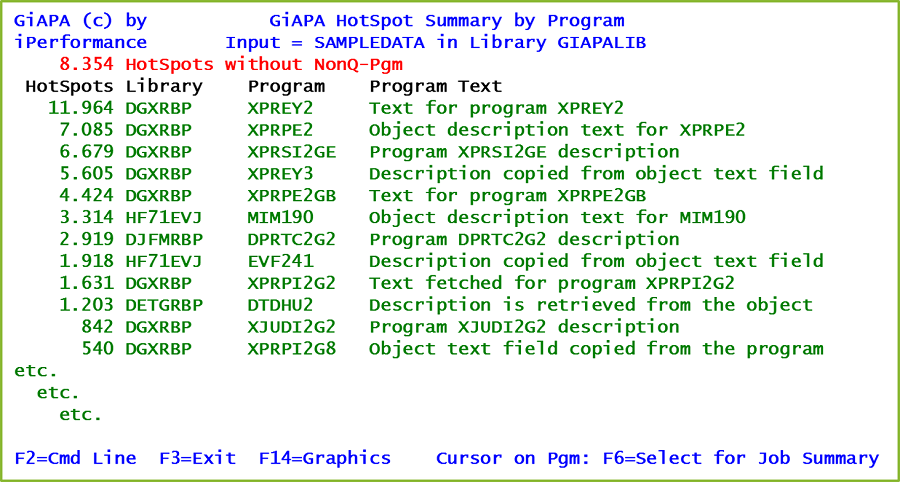
Every time a job within a 15 seconds collection interval uses more than 4 % CPU ( = 600 ms.), GiAPA will take a snapshot of the call stack. The results of these “HotSpots” are sorted together by user program name across all jobs. This enables GiAPA to show which user programs used the most resources, and what they were used for.
Attempting to accumulate as much as possible under the main function running, GiAPA reports in the example below 2,504 HotSpots as belonging to the system API which retrieves member description data. This number includes the many cases where one of the subprograms listed in the yellow box was active. They were running under the retrieve member description API and were therefore the active program in some of the call stacks. However, showing them individually would disturb the overall picture.
In the above new example 1,366 jobs triggered 4,707 HotSpots for the program in the title line. The number of HotSpots per job was therefore on average so low that they in most cases would have gone by unnoticed. But analyzing across all jobs we see that 2,504 HotSpots, or more than half, showed different active programs called directly or indirectly by statement 3979.
It seems unlikely that it is necessary to fetch the member description that often – the API call was probably by a mistake placed inside a loop. Since this is based on sampling – the call stack data is only fetched every 15 seconds – the actual number of calls to the API was probably somewhat more than a thousand times higher.
This option will often reveal optimization potential even in programs and jobs believed to run efficiently.
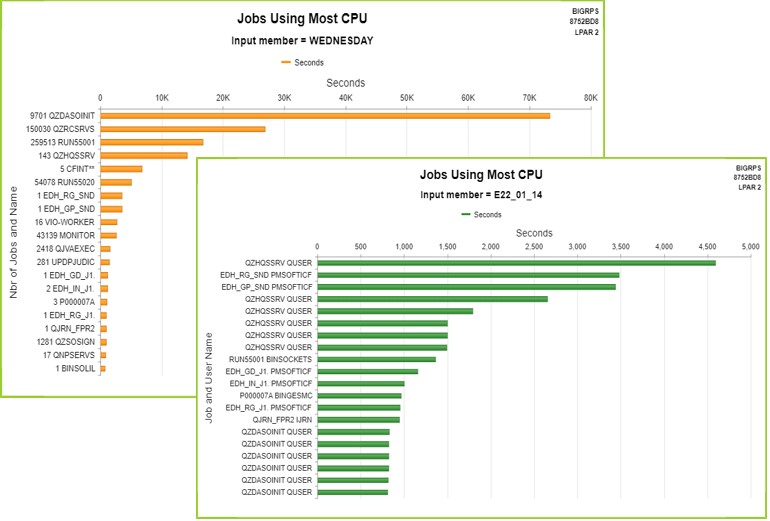
Commands generating diagrams
Several GiAPA commands can generate predefined or user defined diagrams. The bar charts below are standard graphs which can be requested using command command GIAPA052. The user selects how many jobs to show and the input data (time period) to use.
HotSpot Statistics per Program
Also an overview over which jobs caused the most HotSpots is available. The red line in the top of the list indicates HotSpots where the job call stack either did not contain any programs not starting with Q (i.e., contained only IBM programs), or where the call stack was not available (as is the case e.g. when an index is being created).