Call Stack Analysis
GiAPA retrieves up to 99 call stack levels whenever a job uses more than 4 % CPU during a 15 seconds performance data collection interval (99 and 4.0 are user controlled parameters), and calulates in how many percent of the samples each program was active.
Tells where resources were used - down to source code line number!
This means that we for any job using much CPU can see rather exactly where how much time was spent. Since this is sampling, it will only for CPU bound jobs reflect which programs used the most CPU. The values show % of elapsed time, which is what we really care about if optimization is wanted. Commercial applications are normally most of the run time awaiting I/Os. With GiAPA we can see which which file accesses took most of the run time.
Example 1: Call stack analysis (Multi threaded jobs have similar report for each thread)
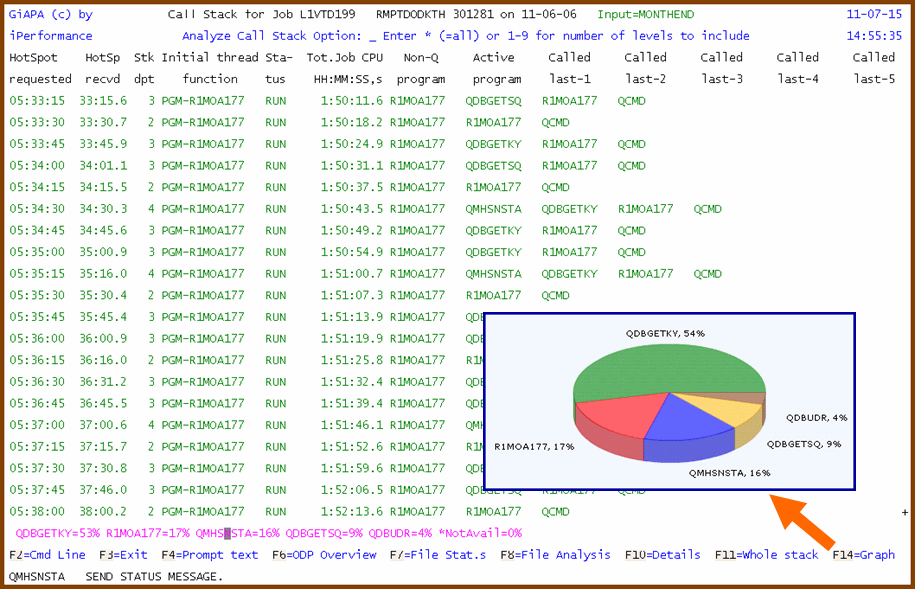
A report like the below appears when F9=Call Stack is used with the cursor positioned on a job on the Job Summary report. See below how easy it is to find significant optimization potential for this job. First look at the pink line in the bottom, giving the total statistics telling that these three programs account for 86 % of the run time:
- 53 % QDBGETKY (Read record by key)
- 17 % R1MOA177 (must be a user program)
- 16 % QMHSNSTA (To see program text, place cursor on name and hit F4: Message line shows "SEND STATUS MESSAGE")
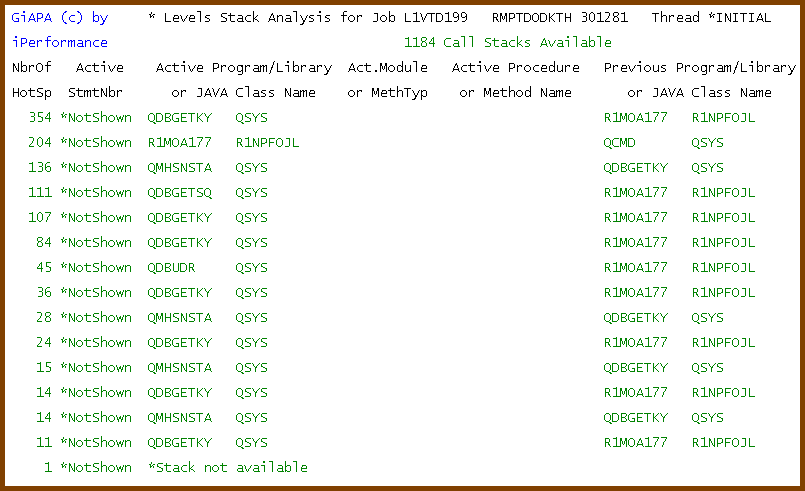
Using the "Analyze Call Stack" option in the top of the screen we get the following statistics for how often each active program was found in different contexts. QDBGETKY is found on several lines, but 354 out of 1184 times (=30 %) originated from one read only. We will look at this by positioning the cursor on the line and use F11 to get the next level of analysis.
Analyzing use of QDBGETKY
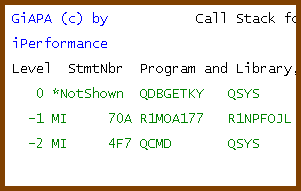
Here is the entire call stack for the above 354 cases where QDBGETKY was active. The name of the calling program and the statement number is shown, through which a compilation list can tell source code line and the file involved.
It appeared to be a file named R1NCMRW. Follow this link to see how GiAPA's file access analysis in this case could show a huge saving potential.
Analysis of program R1MOA177
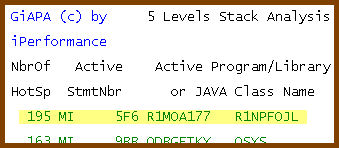
It is most unusual to see a user program using 17 % of the total run time. Hitting F5 on the previous screen causes statement numbers to be shown for even the currently active program. It appeared that program R1MOA177 almost all the time (195 of 204 samples) was processing statement X'5F6'.
A compilation list compiled with GENOPT(*LIST) gave the translation of the hexadecimal addresses into source statement numbers, after which it was easy to see what caused this delay (not discussed here).
Analyzing QMHSNSTA (Send Status Message)
The job being analyzed was a batch job - status messages can only be seen by interactive jobs - but 16 % of the run time was used for sending such messages. They could be a "leftover" from interactive testing of the program, but could also be a sign of an old OPM program - recompiling with the current ILE compiler might save the time used for message handling.

