GiAPA's Triple A: Automatic Application Analysis
The easiest way to locate performance optimization potential is selecting option 20 from the GiAPA Menu and run the fully automatic performance analysis on data collected and expanded/analyzed. Both the data collection and the analysis runs in unattended batch - no performance expertise is needed on the user side.
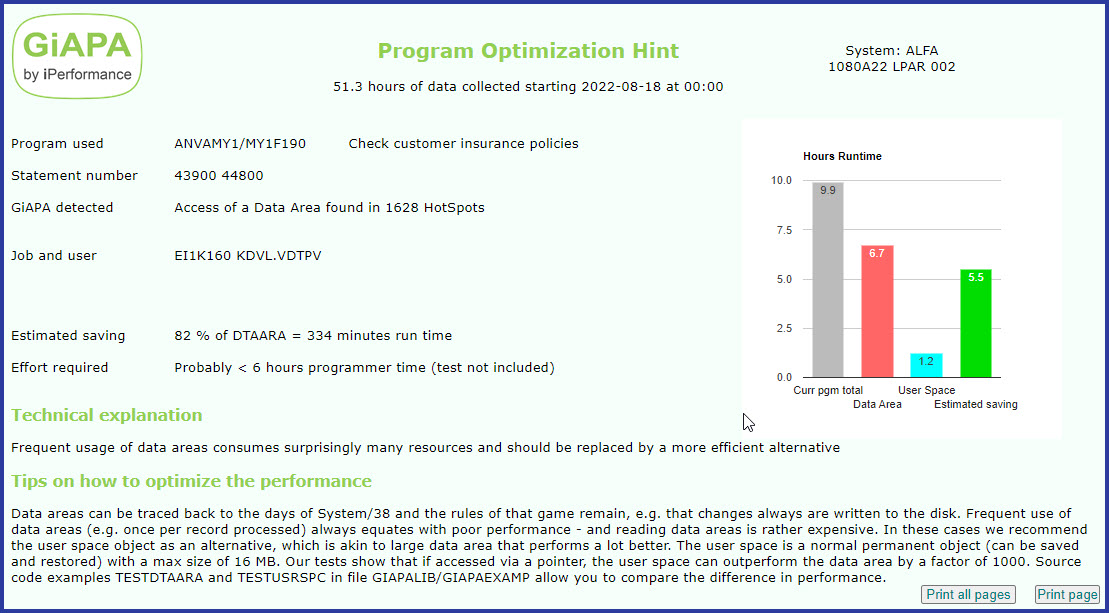
The picture below shows one of the many inefficiencies which GiAPA can identify automatically. Many are rather trivial, but never the less often found - not because the programmer was unaware that the functiont in question might be a little inefficient to use, but because the servers of today are so quick that minor performance flaws are not seen in the tests of the application, which appears to work just fine.
However, when the program suddeny must handle many million records/rows, it might - like shown in this example - make a difference much larger than what the developer could imagine.
But even GiAPA cannot pinpoint all performance problems automatically - but it can deliver more detailed data to enable further analysis than any other tool using so little resources, and there are so many possibilities for additional analysis that only a small part can be shown below.
Finding Jobs to Optimize
There are various ways of finding jobs with optimization potential. The most common is of course to listen to users and operation's staff: Are anybody complaining over extensive response or run times, and/or is the server overburdened by long running jobs using extensive resources?
When we at iPerformance look at data collected from a (potential) customer site, we most often are not told which jobs may be of concern. We normally succeed anyway: GiAPA tells us!
GiAPA’s standard “Job Performance Summary” is a good starting point: By default the sort criteria selected is 5 = CPU time used, but there are as shown in the column to the right many possibilities.
Most commercial applications use more than 2/3 of all resources on I/Os. Therefore we also want to look at jobs appearing in the top of reports sorted on logical or physical I/Os.
Paging is not the problem it used to be, given the much larger memory on the servers today, although the issue pops up from time to time anyway. Sort criteria 15 (Non permanent writes) will show any heavy paging jobs – such jobs could be speeded up if allowed to run in a larger pool, or in a pool without other jobs with higher priority.
For interactive jobs, the report on transaction response time is of course interesting.
The following picture shows a page of the “Job Performance Summary” by CPU usage. GiAPA automatically produces exception reports, not showing the “good behaving” jobs individually. In below example there was 55,556 such batch jobs, which all together had used 68 hours 27 minutes CPU, corresponding to an average of only 4½ seconds per job – we do not need to waste our time looking at such jobs.
(Unless of course there is a small job running thousands of times every day – that could add up to something worthwhile improving – and of course there is a GiAPA report for such cases.)
The analysis of a job is but “a piece of cake”: Just position the cursor on the job, and hit a command key, and the ready-to-use analysis of file accesses or call stacks, or the details per 15 seconds interval will appear.
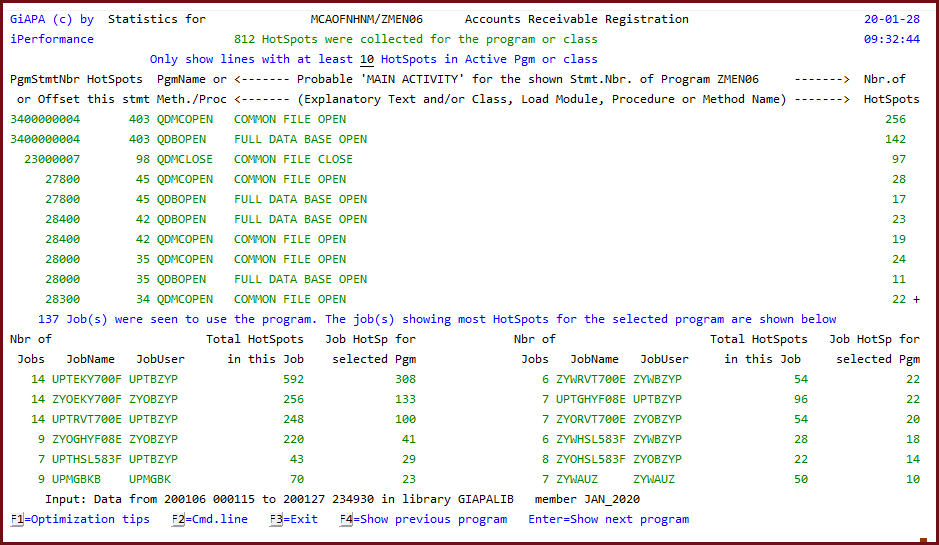
However, GiAPA's performance analysis across all jobs makes it even easier to locate optimization potential. Below example shows a program which was listed by GiAPA because it used almost all the run time on opening and closing files. Keeping the frequently files opened would cut the run time for this frequently used program by more than 90 %.
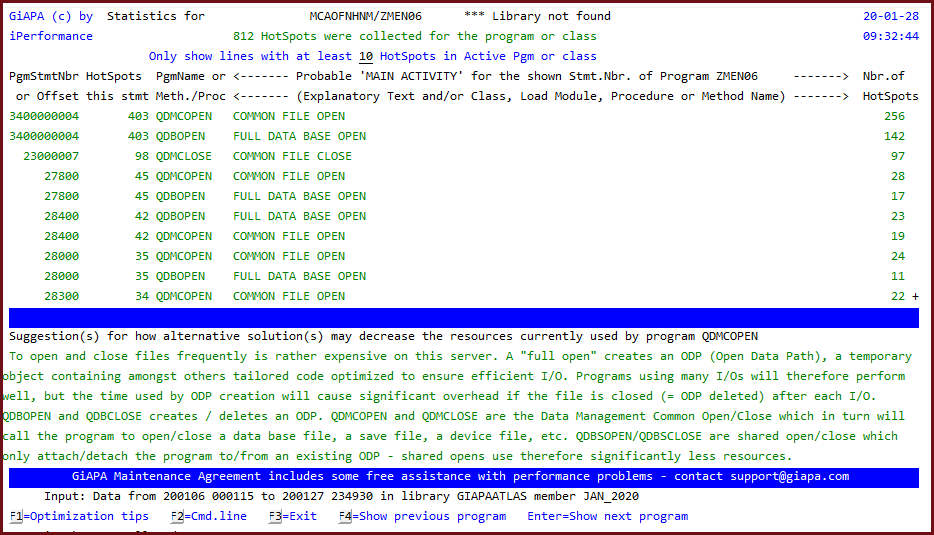
Should it not be obvious how to improve performance for a program, use of "F1=Optimization Tips" with the cursor placed on one of the lines listing the active program functions will replace the second subfile (the list of jobs using the program) with suggestions on what to do - please see the example further down.
One more example: API Called in Inner Program Loop
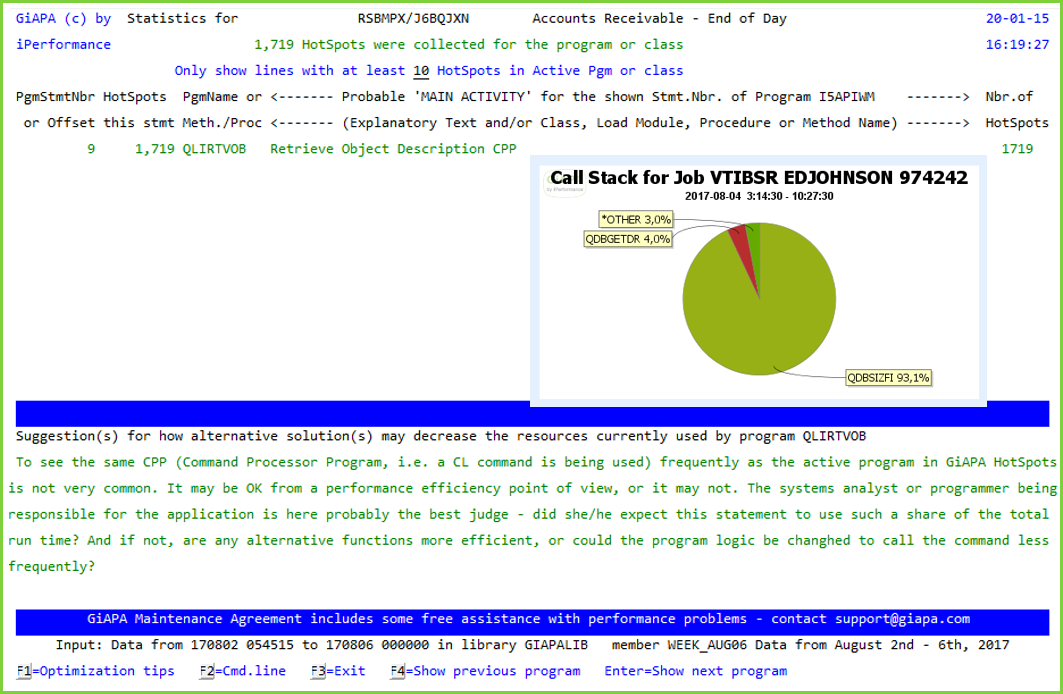
A potential American customer ordered a free GiAPA X-Ray because of performance problems with a job. The actual problem was solved, but it drew much more attention that GiAPA, automatically analyzing all jobs, highlighted another job because 94 % of the run time (over 3½ hours CPU) was used on function QDBSIZFI within the QUSROBJD API. The need for requesting file size information hundreds of times per second seemed unlikely, and was of course a mistake - the RTVOBJD CL command calling the API was placed within the inner loop of the program instead of outside.
The result was a typical GIAPA win-win situation: We got a new customer, and the customer had ROI already from the first GiAPA analysis. The needed change of program source code was easy and took only a few minutes, which is quite normal when optimizing performance, because it is never the complex business logic of the application that must be modified.
GiAPA reported 1,719 calls of "Retrieve Object Description" in code line 9 of program J6BQJXN, and using F1 gave the optimization tips displayed in the bottom of the screen. The call stack pie chart showed that almost all the run time was used on just one utility function - indeed not a normal picture.